

Top 5 Real-Time Data Analytics Projects for Freshers
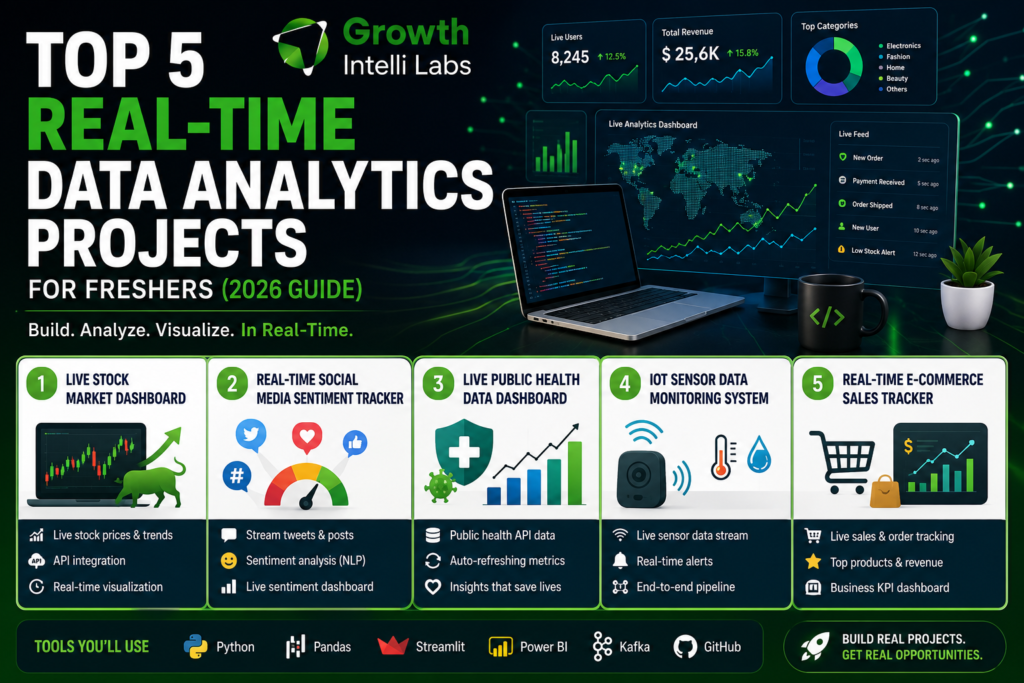
When you include “analyzed a Kaggle dataset” in your resume, you’re just one of the many other freshers seeking plum jobs in a data analyst position. The single thing that stops a recruiter from continuing to scroll is the ability to use data- not pretty data, clean and neat data, but all of which is shown by the real-time data analytics projects in this guide – and these are the five we show you, what they teach, and how to complete and deliver one.
Table of Contents
ToggleWhy Real-Time Data Analytics Projects for Freshers Beat Static Datasets
The majority of Introductory data analytics mini-projects are based on an exported CSV – event cleaned, static, and ready for you to open before you open it. But real, working data isn’t like that. It is incomplete; it has a growing number of updates, and more than a textbook dataset will break your code.
That is why real-time dashboard projects and streaming data projects lend more credibility to recruiters than another static-dataset computation. They let you know you can operate a data pipeline end-to-end – ingest, transform, visualize – in a scenario that is more like a production situation.
For data analytics portfolio projects, you want to get attention from the interviews; put those activities on the priority list above instead of doing data work with a downloaded and fixed file.
1. A live, real-time stock trading dashboard. A real time dashboard for live stock trading.
Scrape intraday prices for trading stocks using a free market data API, manipulate the data with python, and feed it to a dashboard; which will automatically update live. Scrape live stock prices using a free market data API, manipulate the data using python, and feed it into a dashboard that updates when the price changes. In a way, this is one of the most sought after Python data analytics projects for a good reason: it requires you to work with API authentication, API rate limits, malformed API responses and real-time visualization of time series data, all as part of a build!
Open-source stack: Python (free stock API – e.g., Alpha Vantage, Yahoo Finance), Pandas, Plotly / Streamlit for dashboard.
It demonstrates skills in API integration, real-time data ingestion, and time-series visualization.
Resume line: “Developed a real-time stock dashboard that provides live-market data through API, processes and visualizes price movements within less than 5 seconds.
2. Real-Time Social Media Sentiment Tracker.
Analyze streaming posts in real time while they’re coming in around a keyword or hashtag instead of analyzing a fixed set of posts. This is a better and more recent project than several of the data analytics portfolio projects as it reflects managing streaming data and simple NLP, which are two abilities that frequently turn up in real analyst/data engineer jobs.
Core stack: Python, Tweepy or another wrapper for a streaming service, TextBlob/NLTK for sentiment scoring, a live graph to show output.
Skills it demonstrates: Streaming ingestion, basic NLP, real-time visualization.
Line 3: “Developed a sentiment tracker that consumed real-time social media streams to provide an up-to-date sentiment score and visualisations of the sentiment trends.”
3. Live Public Health Data Dashboard
Extract data from a public health API (for case counts, hospitalizations, vaccination rates) and create a dashboard that will refresh with the health data as they do. One of the most reliable real-time dashboard projects to build is this one that uses data from a well-documented source that is truly real-time and updates on a schedule – not just faux real-time that gets put on a dashboard for a show.
Core stack Python: Public health/government API layer, Power BI or Tableau: Dashboard layer.
Skills it demonstrates: Skills in making a data pipeline, dashboarding tools, dealing with frequently refreshed data sets.
The opening line of the resume reads: “Built an automatic live public health dashboard with the key metrics getting pulled every hour from a government API.”
4. IoT Sensor Data Monitoring System
If you want to create a project that is more towards data engineering as well as not purely analytics projects, then build this one. Simulate or source live IoT sensor reading data – for temperature, humidity or motion – streaming to a processing pipeline, and visualize data in realtime.
The Core stack consists of Python, MQTT or a simulated sensor feed and Kafka (optional, for a more pronounced engineering signal), while a live dashboard tool is provided for the feedback.
Skills it demonstrates: Ownership of the whole pipeline (ingestion, processing, presentation) as well as alert logic that works in real time.
Built an end-to-end IoT monitoring pipeline to process realtime sensor data with a realtime threshold alarm triggered.
5. Track E-Commerce sales in real-time.Real-Time E-Commerce Sales Tracker.
Simulate real-time data that is usually associated with an online order or incur an open e-commerce dataset and create a dashboard that responds to on-the-fly sales, top products, and revenue. This is the one of the resume friendly data projects to add to a resume, in every editor’s eyes, this relates to a universally understood and used metric in a business context – revenue.
Tools you will use: Python, a simulated transaction STREAM generator, Pandas, Streamlit or IBM PowerBI.
Skills demonstrated: Tell a story with the Dashboard for a non-technical audience; Track live KPI in Business-context.
Resume line: “Developed a sales analysis dashboard showing real-time revenues and best-selling products from a number of simulated orders.”
The following details explain how to decide on your first project.
When choosing only one out of a number to begin with:
New to APIs? Begin with the stock market dashboard – the best documentation – and the most beginner tutorials.
Want to be one of the unique candidates using NLP? Follow with the sentiment tracker.
Specifically looking for a data engineering job? Develop the IoT pipeline – it indicates the most technical depth.
If you’re applying to business/e-commerce positions: The sales tracker speaks directly to what’s on hiring managers’ mind on the sale.
Don’t attempt to develop the five before adopting them. One project is complete, documented and deployed, three half built repos are nothing next time
The Tools You'll ACTUALLY Need
A variety of streaming/ingestion methods such as the REST API, Tweepy, MQTT, or Kafka for more advanced pipelines.
Streamlit, Power BI, or Tableau can be used for visualization. Visualization can use Streamlit, Power BI, or Tableau.
Project files: On GitHub (no README required there) and a live demo link (useful if you can deploy your project; Streamlit Cloud is free and easy)
Recruiters look at the link on your CV; if it doesn’t have a short README saying “I did this with…) and there’s no link to a public GitHub project – it does not constitute a truly portfolio-worthy project!
FAQs
They demonstrate you can handle live, unstructured, fast-moving data - a stronger signal of job-readiness than static CSV-based projects, and a common theme in data analyst interview questions.
Commonly Python, SQL, streaming APIs, Kafka for advanced pipelines, and Power BI or Tableau for visualization.
No. Most beginner-friendly real-time projects only need basic Python and SQL, with free tutorials and open APIs widely available.
On GitHub with a clear README, and linked directly from your resume and LinkedIn recruiters check these links first.
Anywhere from a few days to 2–3 weeks, depending on complexity and how much of the pipeline (ingestion, processing, visualization) you build yourself versus using existing tools.