

Will Data Analytics be a Good Career in 2027? Salary, Demand & Future
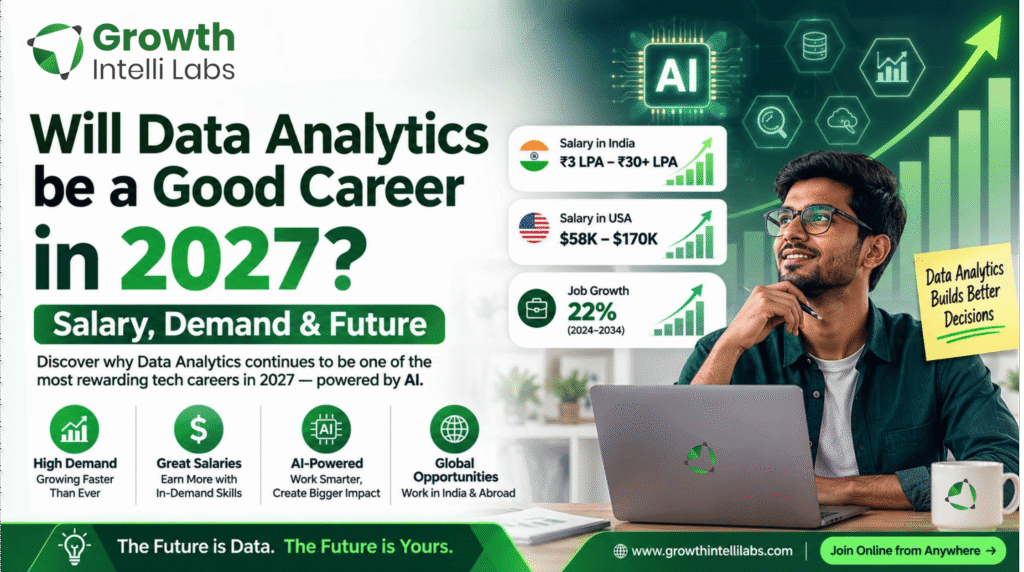
Table of Contents
ToggleThe Short Answer
Data Analytics remains one of the more approachable, lucrative paths into the tech world today. This part remains unchanged.
Why This Question Feels Urgent Right Now
Data Analyst Salary in 2027: What You'll Actually Earn
The salary in the United States
Data analyst pay ranges from an Excel and dashboards generalist to someone who is essentially a data engineer, working with SQL on a Snowflake warehouse. The big salary trackers are all aligned for 2026, the base year for any 2027 estimate:
| Level | Typical Range | Source |
|---|---|---|
| Entry-level (0–1 yr) | $58,000 – $75,000 | Glassdoor, CodingTemple |
| Early career (1–4 yrs) | $70,000 – $98,000 | PayScale, KORE1 |
| Mid-career (4–7 yrs) | $90,000 – $117,000 | Robert Half, Built In |
| Senior (8+ yrs) | $110,000 – $170,000 | Glassdoor, CodingTemple |
The average is found in the middle of this range, from $82,000 to $93,000, which is where the averages from Indeed, ZipRecruiter, and Glassdoor fall. Industry is more important than might be thought. The highest-paid jobs are in financial services, with an average salary of $101,767, followed by energy and aerospace. Retail and non-profits are paid the least.
Important note: The BLS does not have an occupation code for “Data Analyst.” The most similar occupation is Operations Research Analysts (SOC 15-2031) which had a median wage of $88,000 in the May 2024 wage survey, with the highest 10 per cent earning $171,710.
Salary in India
Freshers can expect a salary range of ₹3 LPA to ₹6 LPA, with the ability to perform well on SQL, Python, and Power BI bringing the offers up to ₹8 LPA from companies such as Accenture, TCS, and Cognizant. Mid-level Analysts (2-5 years) get paid between ₹6 LPA to ₹14 LPA. The salaries for senior analysts and Analytics leads lie in the range of ₹20 lakh per annum and some are able to earn a higher amount like ₹30 lakh per annum in top firms.
What REALLY Moves Your Number Up
There are three elements which make it possible to distinguish a ₹4 LPA offer from a ₹8 LPA offer, or a $65,000 offer from a $95,000 one, at the same experience.
1.5X the depth of the tool width. Being very good at SQL is better than being five bits on SQL with five bits on each BI tool.
- Tool depth over tool breadth. Being very good at SQL is better than being five bits on SQL with five bits on each BI tool.
- Judgement & Not Just Charts in a Portfolio. Employers want evidence that you can, and not merely visualize, decide what to measure.
- Domain knowledge. Knowing how to interpret data is more valuable than the query itself, so an analyst is paid more if they know the billing or SaaS retention metrics in the context of the healthcare industry.
Job Demand: Is Anyone Actually Hiring Data Analysts?
Yes. The Operations Research Analyst occupation close to being the closest match for Data Analytics is expected to increase by 22% from 2024 to 2034, more than 5 times the national growth rate for all occupations in the US. The more technical of the two jobs, data scientist positions are expected to expand by 34% in the same time period.
NASSCOM forecasts that data analytics job demand in India will more than double in year 2026 itself with banking, e-commerce and health-care being key growth drivers. On its own, Research.com’s reporting of findings on jobs for data analytics degrees indicated an increase of 15% from 2019 to 2023, increasing another 31% through 2030.
Will AI Replace Data Analysts? The Actual 2026 Data
No, but that doesn’t mean that AI hasn’t automated a significant portion of the work.
- AI creates an initial SQL query and cleans raw data.
- The analyst reviews the output and catches any silent row duplication caused by the join.
- AI produces an initial chart and summary.
- The analyst ensures that the summary answers the business question being asked and provides AI with any context it does not have (e.g., product launches, changes in prices, seasonality) before presenting the summary.
Data Analyst vs. Data Scientist vs. Data Engineer: Which Pays More?
The three roles differ more in daily work than most comparison posts admit.
| Data Analyst | Data Scientist | Data Engineer | |
|---|---|---|---|
| Core job | Interpret data, build reports, answer “what happened” | Build predictive models, answer “what will happen” | Build and maintain data pipelines and infrastructure |
| US avg. salary (2026) | ~$84,000–$93,000 | ~$112,000–$118,000 | ~$100,000–$130,000+ |
| BLS growth projection | ~22% (via Operations Research Analysts) | ~34% | Folded into broader software/database roles, similarly strong |
| Entry barrier | Lowest: SQL, Excel, and one BI tool get you in the door | Medium-high: needs statistics and ML fundamentals | High: needs production coding and cloud infrastructure experience |
| Remote availability | Best of the three | Moderate | Shrinking fast: ~2% of postings fully remote in 2025, down from 10% in 2024 |
An important trend to note is that data engineers now seem to be receiving, in general, 8–15% more than data scientists at comparable levels, reversing the trend from 2018–2020 when data science was clearly better-paid. If aiming for the highest salaries, engineering and specialized data science outperform analytics. If seeking the fastest and cheapest methods of starting a career with good income and room for growth, analytics is still the winner in terms of accessibility.
Skills That Will Actually Get You Hired in 2027
AccioJob analyzed 328 real data analytics job descriptions in 2026 instead of guessing. The results were blunter than most “skills to learn” lists:
| Skill | Appears in job postings |
|---|---|
| Excel | 81% |
| SQL | 60% |
| Power BI | 43% |
| Python | 41% |
| Communication (explicitly listed) | 27% |
| Tableau | 2% |
Two key points can be drawn here. Excel is not dead, despite boot camp marketing claims, and in this example, Power BI seems to have passed Tableau concerning demand, presumably because it is bundled at no additional cost with Microsoft 365, which most users already subscribe to. Apart from the main tools, three additional skill sets make the difference between analysts promoted versus those replaced:
- Business sense:Recognizing what drives revenue or retention in one’s industry insteadofmere abstract data.
- Data narrative:Ensuring that someone does not merely look at facts but makes a decision based on them.
- AI fluency:Using, confirming, and correcting the AI output faster than creating it from scratch. This becomes as essential as using SQL five years ago.
The following certifications are desirable to have in approximately the succeeding order of employer recognition: Google Data Analytics Certificate, Microsoft PL-300 (Power BI), or any credential that comes with a significant real–life project.
Who Should Skip This Career
Many guides do not discuss this topic. However, it is essential in becoming a successful data analyst.
Data analytics is inappropriate for you if you like certainty. The job is rarely, “Follow this procedure to get this result.” It is more about: “Find the source of this number error using incomplete information before the meeting on Monday.” If you are looking for a job where your objective is clear and the answer to a particular problem is known, you should look for work in the sphere of software engineering or tech trade.
It is also not the right choice if you want to do it only because it is well-paid and it requires no coding. Every source used in this paper that provides information on the skills needed for the profession names SQL as one of the necessary skills.
How to Future-Proof Your Data Analytics Career: A 2027 Roadmap
Months 1 – 3: Lay the foundation. Study SQL properly (including joins, window functions, CTEs, and not only SELECT statements) and get beyond the basics of Excel or Google Sheets. Create 2basic dashboards in, say, Power BI or Tableau based on publicly available datasets.
Months 4 – 6: Bring something unique. Study Python for data purposes in particular (e.g. Pandas, some light automation), not for software development in general. Choose one industry, for example that of finance, healthcare, e-commerce, or any other that keeps you curious, and start accumulating data about the industry.
Months 7 – 9: Use what‘s impossible for AI to do. Work with a real or simulated messy dataset which lacks a clear answer and defend your findings before someone who will raise objections. Present your conclusions orally, not only via slides. Most self-taught analysts will skip this stage, although hiring managers want to check this out.
Months 10 – 12: Create examples of experience. Make three projects for your portfolio, each of which will include a business question, messy data, your process, your offer and a follow–up. Your portfolio demonstrating your common sense will be much more valuable than your compilation of certificates
Frequently Asked Questions
Entry-level applications are more competitive than three years ago, but demand still outpaces supply overall. NASSCOM projects Indian hiring demand up 25%+ in 2026, and BLS projects continued double-digit US growth through 2034. The saturation is concentrated in junior, report-only roles, not the field as a whole.
No. Most employers care more about a portfolio and demonstrated SQL skills than a specific degree. A relevant degree helps at large corporates and government roles, but bootcamp graduates and self-taught analysts fill a large share of postings, especially at mid-size companies.
It's different, not harder. Data science leans on statistics and machine learning theory. Data analytics leans on business context, SQL fluency, and communication. Most people find the entry curve gentler; the ceiling is lower unless you specialize further.
Every growth projection covering this decade, from BLS to NASSCOM to independent job-posting analyses, points to continued expansion through at least 2030–2034. The specific tools will change. The need to turn data into decisions won't.
SQL first, always. Add one visualization tool (Power BI currently has the strongest demand-to-competition ratio), then Python, then a portfolio built on real or realistic business questions. Three to six months of focused work gets most people to entry-level readiness.
The Verdict: Is Data Analytics be a Good Career in 2027?
Yes, with a condition attached. The version of data analytics that’s still a good career in 2027 is the one where you’re the person who catches what AI gets wrong, not the person AI replaced. Salaries remain strong across the US and India. Demand is growing faster than the average occupation in both markets. The entry barrier is still lower than most tech careers.
The job itself moved up a level: less time producing numbers, more time deciding what they mean. If that trade sounds like a good one, 2027 is a solid year to start.