

The Right Order to Learn SQL for Data Analytics (Step-by-Step Roadmap)
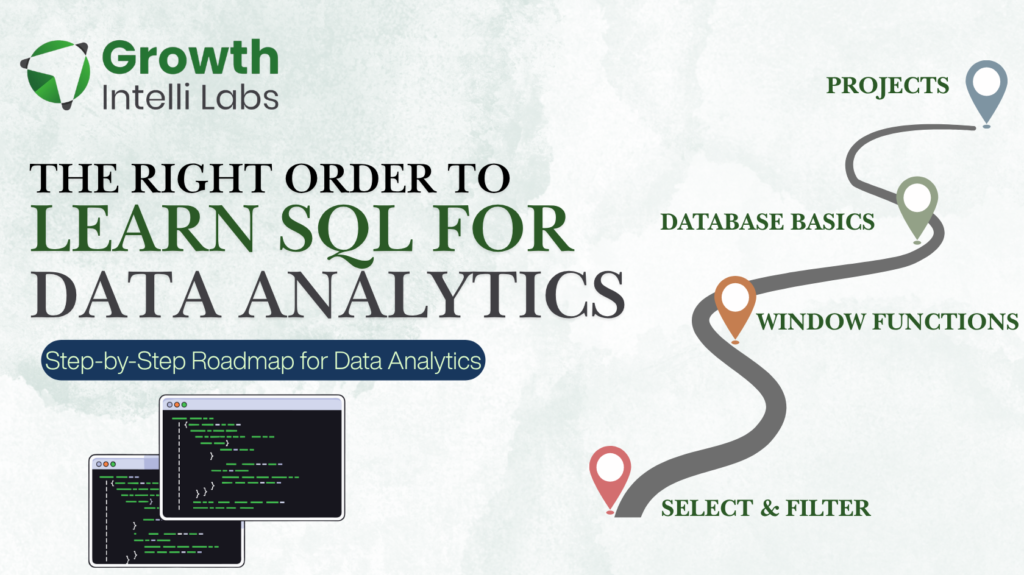
Search “how to learn SQL” and you get a long list of commands: SELECT, JOIN, GROUP BY, subqueries, indexes. Nobody tells you which to learn first, which to practise most, and which ones analysts use every single day.
That gap is why many beginners spend weeks on SQL and still freeze when a manager asks, “Can you pull last month’s sales by region?”
This guide fixes that. It lays out the order that works for data analytics, based on how SQL is used on the job, not how a textbook lists it. It is the same path we teach at Growth IntelliLabs in Hyderabad.
Table of Contents
ToggleWhy the Order Matters
SQL is not a pile of separate commands. Each skill sits on top of the one before it. Try joins before you understand filtering and you will get confusing results. Try window functions before aggregation and they will never click.
A clear order saves you weeks of confusion, and it keeps you practising the skills that matter most for analyst work.
Step 1: Read and Filter Data
Start with the foundation: SELECT, FROM, WHERE, ORDER BY, LIMIT and DISTINCT.
SELECT customer_name, city, order_value
FROM orders
WHERE city = 'Hyderabad'
ORDER BY order_value DESC
LIMIT 10;
This one query already answers a real business question: who are our top ten customers in Hyderabad? Spend time here. Every later skill builds on these five lines.
Add the filter operators too: AND, OR, IN, BETWEEN, LIKE and IS NULL. Handling NULL values early will save you from silent errors later.
Step 2: Summarise Data with Aggregates
Business questions are rarely about single rows. They ask “how many?”, “how much?” and “what is the average?”
Learn COUNT, SUM, AVG, MIN and MAX, then pair them with GROUP BY and HAVING.
SELECT city, SUM(order_value) AS total_sales
FROM orders
GROUP BY city
HAVING SUM(order_value) > 100000;
This is the single most used pattern in analytics. Practise it until you can write it without looking.
Step 3: Combine Tables with Joins
Real data never lives in one table. Customers, orders and products are stored separately, and joins bring them together.
Learn INNER JOIN and LEFT JOIN first. They cover most daily work. Then add FULL JOIN and self joins.
The key habit: before you run a join, ask how many rows you expect back. If the number looks wrong, your join keys are probably duplicated.
Step 4: Clean and Categorise Data
Raw data is messy. This step turns it into something you can report on.
CASE WHENcreates categories, such as “High”, “Medium” and “Low” value customersCOALESCEreplaces missing values- Date functions pull out month, quarter and year
- String functions trim, split and standardise text
Many learners skip CASE WHEN. Analysts use it constantly.
Step 5: Break Big Questions into Steps
Once queries get longer, they get harder to read. Subqueries and Common Table Expressions (CTEs) fix that.
Learn subqueries first so you understand the idea of a query inside a query. Then move to CTEs with the WITH keyword, which let you name each step and read the logic top to bottom. In team settings, CTEs are the standard for readable SQL.
Step 6: Rank and Compare with Window Functions
This is the step that separates beginners from working analysts.
Window functions calculate across related rows without collapsing them. Learn ROW_NUMBER, RANK, DENSE_RANK, LAG, LEAD and running totals with SUM() OVER.
They answer questions like:
- Who are the top three customers in each city?
- How did sales change compared with last month?
- What is the running total of revenue this year?
Most tutorials leave these for last, or skip them. Do not. Window functions come up in analyst interviews and in day-to-day reporting.
Step 7: Understand How Databases Work
You do not need to become a database administrator. But a basic understanding makes you a safer, faster analyst.
Cover primary and foreign keys, data types, and table relationships. Learn the basics of CREATE, INSERT, UPDATE and DELETE. Get a feel for indexes and how to read a query plan with EXPLAIN, so you know why one query runs in seconds and another takes minutes.
Step 8: Build Real Projects
Knowing syntax is not the same as doing analysis. The final step is applying everything to a business problem.
Good project ideas:
- Sales performance analysis by region and product
- Customer retention and churn analysis
- Monthly cohort analysis
- A reporting dashboard in Power BI or Tableau, powered by your SQL queries
Projects prove your skills to employers far better than a list of commands on a resume. They also show you how SQL connects to the rest of the analytics workflow.
Common Mistakes to Avoid
Jumping to joins too early. Without solid filtering and aggregation, joins produce results you cannot verify.
Memorising instead of practising. Syntax fades fast. Writing queries against real datasets makes it stick.
Ignoring NULLs. They quietly break counts and averages.
Skipping window functions. They are a core analyst skill, not an advanced extra.
Learning without a goal. Pick a business question first, then write the SQL to answer it.
FAQ
The core of SQL is the same everywhere. MySQL and PostgreSQL are both excellent, free places to start. Small syntax differences exist, mainly in date functions, but everything above transfers across systems.
It depends on your practice time. With steady daily practice, most learners can handle Steps 1 to 4 comfortably within a few weeks, and reach window functions and project work soon after. Consistency beats long, irregular sessions.
At Growth IntelliLabs, our data analytics training follows exactly this path. You learn each concept in order, practise on business datasets, and finish with portfolio projects that show employers what you can do.
No jumping ahead. No gaps. Just a clear route from your first SELECT to real analyst work.